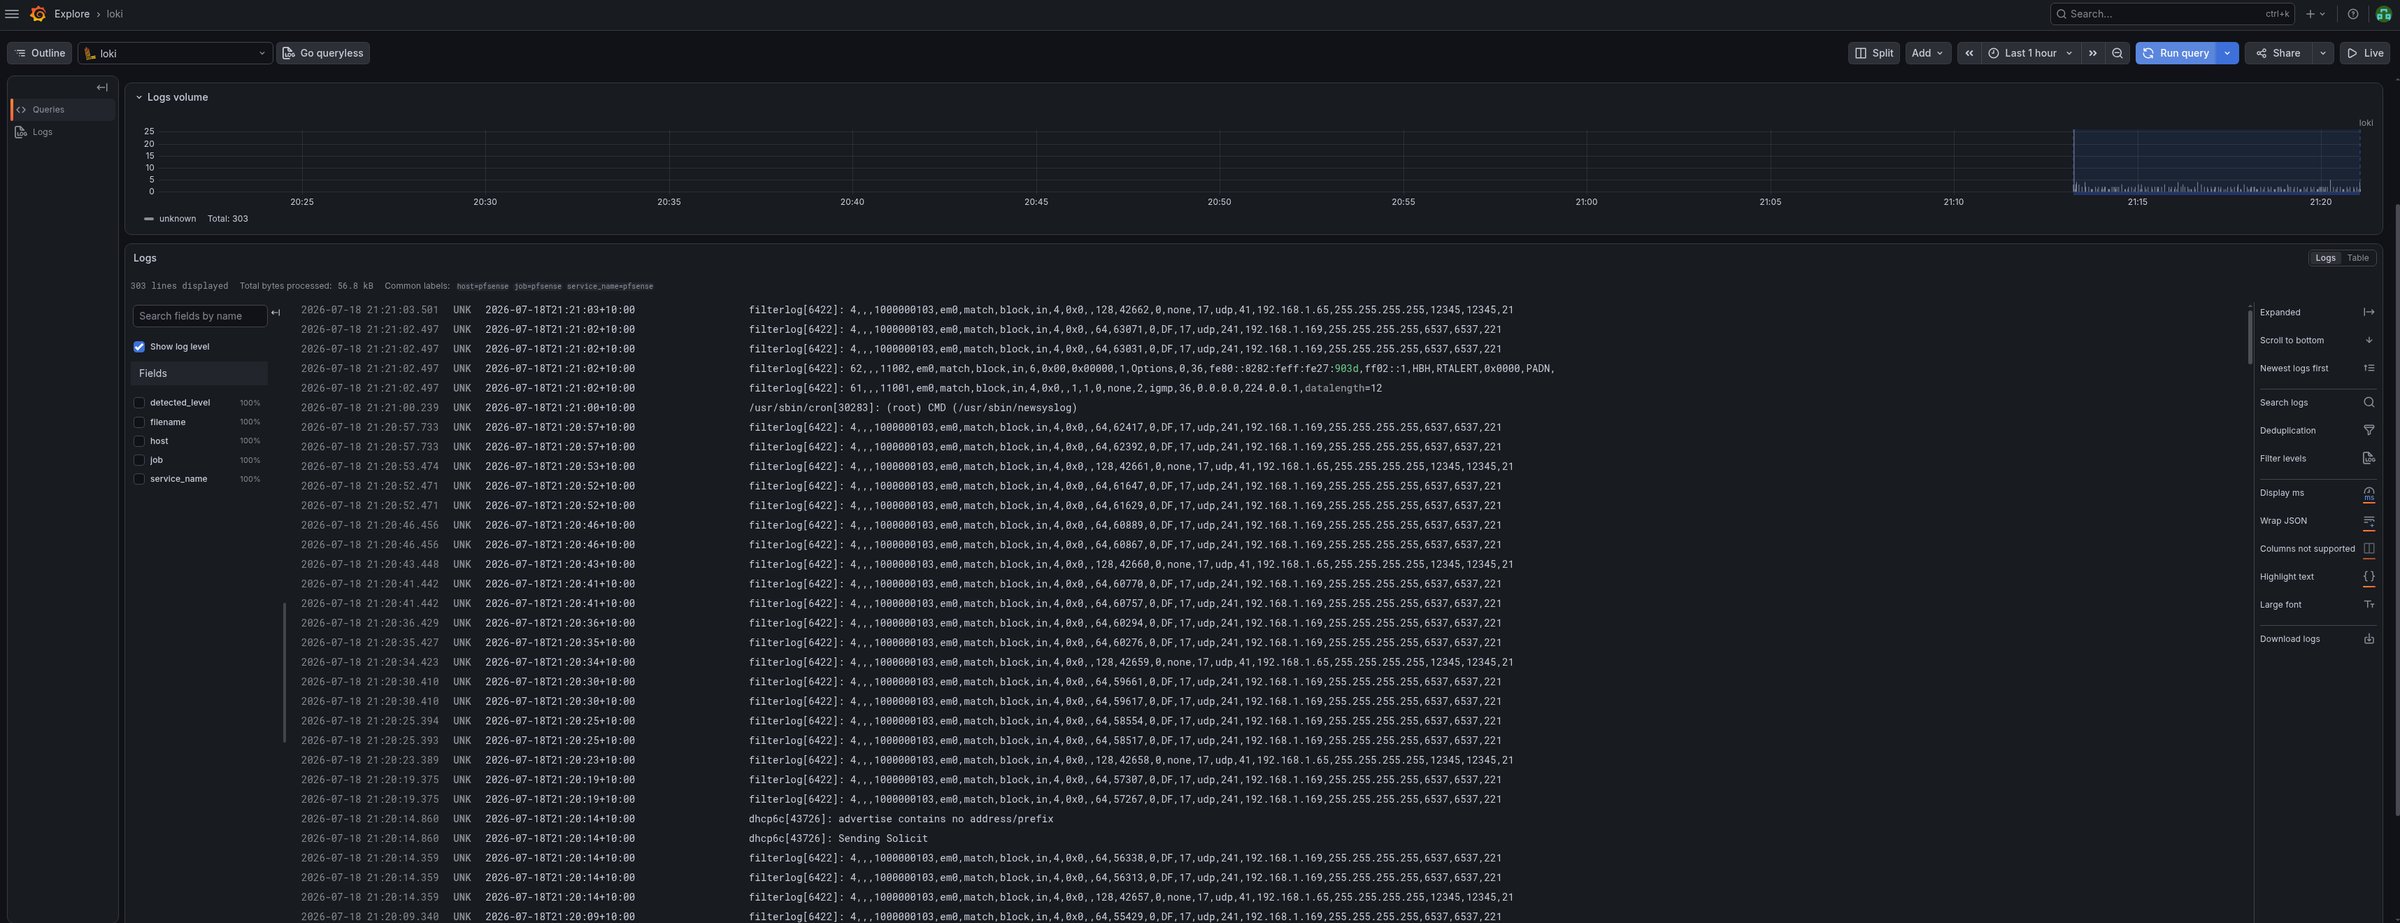
Grafana Explore showing pfSense firewall logs flowing through Loki, with a log-volume chart above

Building a Homelab SIEM with Loki — Reading My Logs Instead of Hoping

I had dashboards showing me numbers — CPU, memory, network throughput. What I didn’t have was any way to answer “what actually happened?” When did someone try to log in? What did the firewall block? Those answers live in logs, and my logs were scattered across machines, unread. This post is how I pulled them into one searchable place. That’s a SIEM — Security Information and Event Management — and you can build a simple one at home. ...
19 July 2026 · 7 min
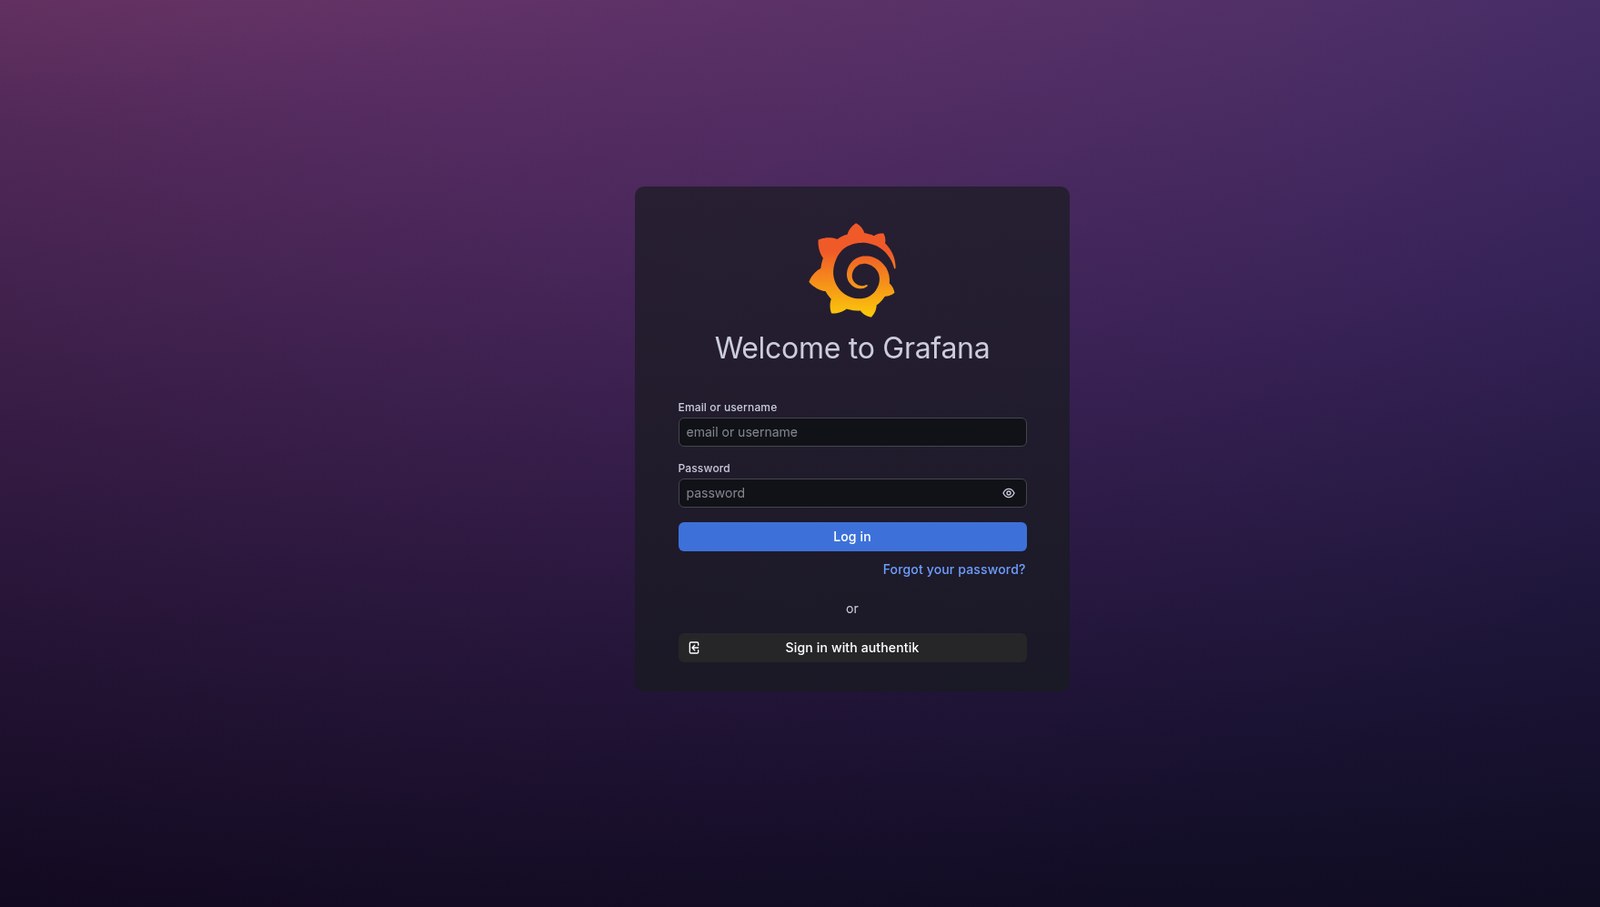
Grafana's login page with a Sign in with authentik button

One Login, MFA Everywhere: Adding an Identity Provider to the Homelab

Deploying Authentik as a self-hosted identity provider, and wiring Grafana into it with OIDC — so a service that has never heard of MFA suddenly requires it. Stack: Authentik · Caddy · Grafana · Docker · Debian 1. Purpose Every self-hosted service arrives with its own login. Ten services means ten accounts, ten passwords, and ten places to forget to enable MFA. Worse, some services have no authentication at all and just quietly assume nobody hostile is on your network. ...

15 July 2026 · 9 min
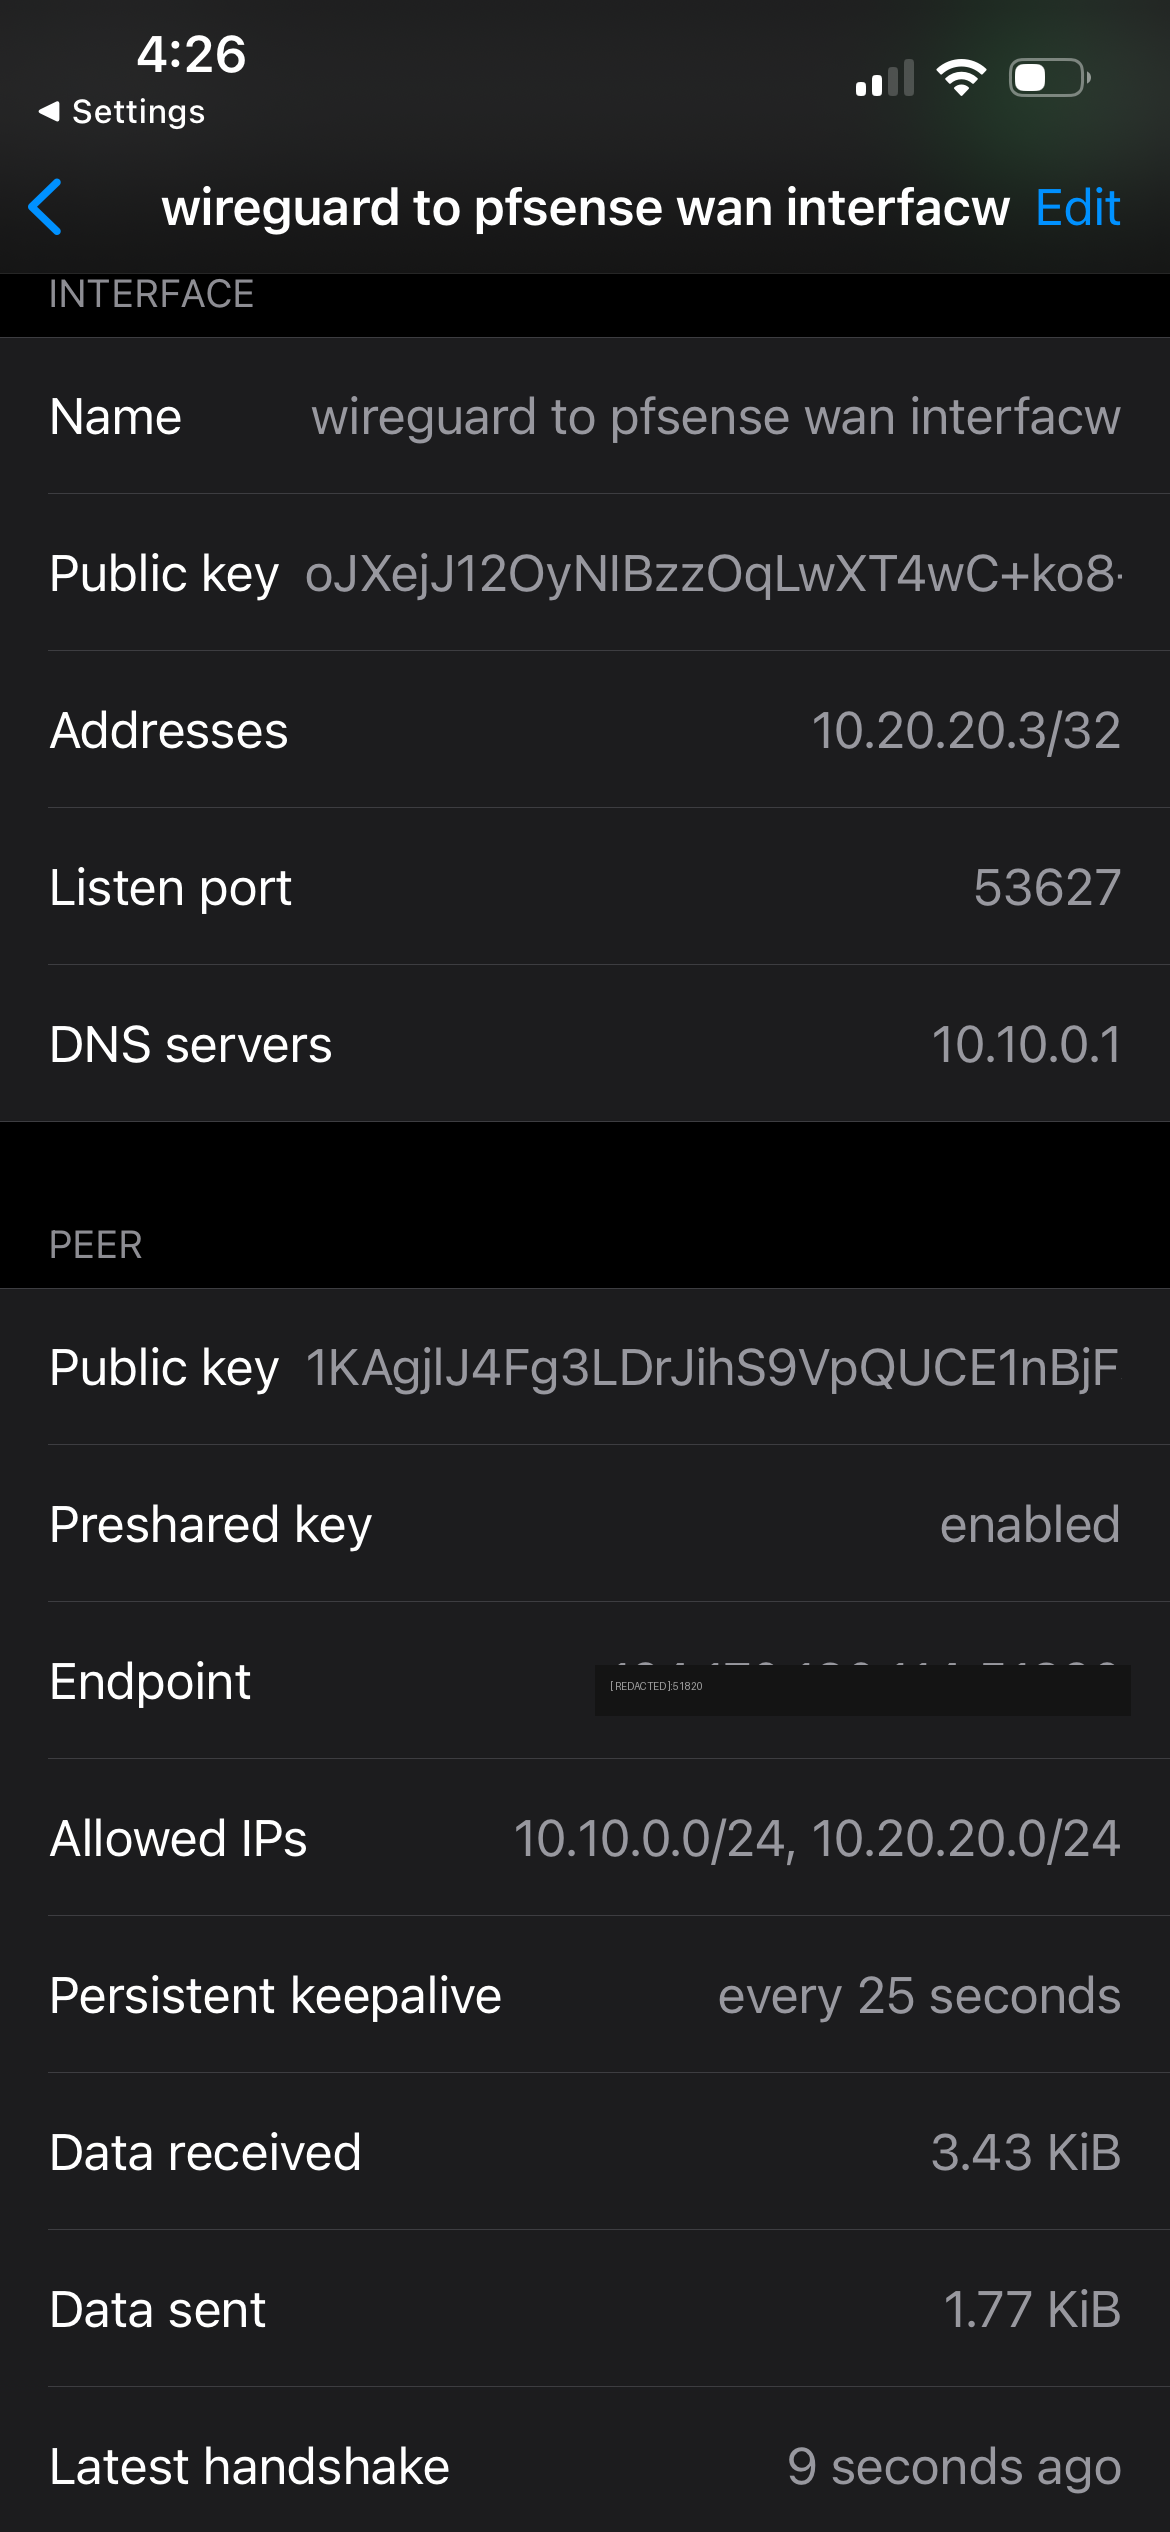
WireGuard handshake established over mobile data

Self-Hosted WireGuard Through a Nested Firewall — and the Four-Layer Debug to Make It Work

My lab is deliberately isolated — an automation VM (CLAUDDEB) sits behind a virtual pfSense firewall on a segment (10.10.0.0/24) that my home network can’t reach. That isolation is great until you’re out of the house and want to check your Grafana dashboards, which only listen inside that segment. I already use Tailscale for casual remote access, and I’ll be honest up front: for pure convenience, Tailscale wins — it punches through NAT automatically with zero firewall work. But this project wasn’t about convenience. It was about building the thing Tailscale is made of. Tailscale is WireGuard under the hood; hand-rolling raw WireGuard on pfSense teaches you how VPNs actually work — keys, peers, routing, firewall rules, NAT — at a level the managed tool deliberately hides. So I built it from scratch, kept Tailscale as my daily driver, and got a genuinely brutal debugging lesson in the process. ...

11 July 2026 · 7 min
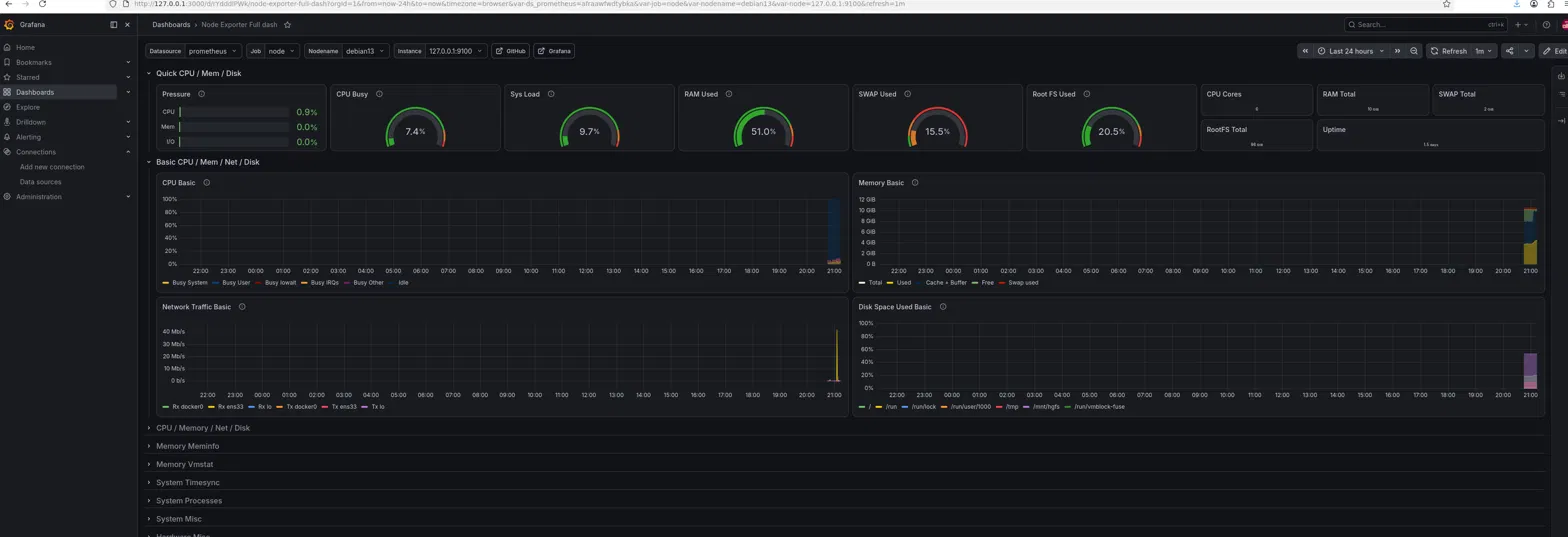
Grafana Node Exporter dashboard for the Debian VM

Building a Prometheus and Grafana Observability Stack for My Home Lab

My LaMetric display gives an at-a-glance read on the lab, but it’s a spot reading with no history — good for “is something on fire right now,” useless for “what happened overnight.” This project adds the layer underneath: a Prometheus + Grafana stack that scrapes my hosts continuously, stores the history, and draws real dashboards. Two targets: CLAUDDEB (my Debian automation VM) and my pfSense firewall, reusing the exact SNMP setup from the pfSense post — just pointed at something far more capable than a 37-pixel display. ...

6 July 2026 · 6 min